10 Data Visualization Tools To Bring Analytics Into Focus
Data visualizations can help business users understand analytics insights and actually see the reasons why certain recommendations make the most sense. Traditional business intelligence and analytics vendors, as well as newer market entrants, are offering data visualization technologies and platforms. Here's a collection of 10 data visualization tools worthy of your consideration.
6/1/2016
An article from June 2016 found at informationweek.com and commented on here.
Note: this is simply kept at a reference. Not actually tried any of these particular tools as we are more open-source focused.
|
Creating clear data visualizations is imperative for communicating insights and analysis about that data and offering guidance for actions based on those insights. With so many leading organizations relying on analytics projects to drive business strategies, the importance of data visualizations will only increase.
This market has been undergoing a bit of a renaissance recently. Many traditional enterprise vendors in the business intelligence space have some form of visualization technology built right into their software. These players are continually adding functions to modernize their platforms for today's market.
The rise of cloud deployments, the desire for getting data and insights quickly (maybe even in real-time), and the need to execute on insights in a timely manner are all changing the game. Another game-changer is the exponential increase in the amount of data gathered by and available to organizations today.
Some of this data may be in a format easily tapped by traditional BI tools. But new, unstructured data types are adding new requirements for vendors offering data visualization technologies.
Gartner recognized this transformation in its 2016 Gartner Magic Quadrant for Business Intelligence and Analytics Platforms. The research firm dropped some vendors from its report, and acknowledged the changes afoot in the space.
So, even as traditional players add functionality to their existing offerings in order to modernize their data visualization technology, newer players are entering the market.
Many of these newer players offer low-overhead cloud-based solutions that line-of-business users find easy to consume and deploy on their own, without consulting the IT organization. It could even be considered a strategy for some data visualization vendors to "land and expand" by getting a foot in the door with non-IT users. Once inside an organization, these vendors will seek to broaden their footprint in the enterprise as more users within the organization find value in their particular data visualization offering.
With these factors in mind, we've collected 10 data visualization technologies for your consideration.
Some of these visualization offerings come from traditional enterprise players in the data and analytics market, which will most likely be used by companies already operating on the vendors' core platforms. Other, newer market entries are included as well, offering a view of some of the functionality available in the cloud. Many of these are available to try without making a big capital commitment.
This list is not meant to be all-inclusive. We encourage you to add in the comments section below any favorites you don't see listed here.
Jessica Davis has spent a career covering the intersection of business and technology at titles including IDG's Infoworld, Ziff Davis Enterprise's eWeek and Channel Insider, and Penton Technology's MSPmentor. She's passionate about the practical use of business intelligence, ...
(No comments officially publiced yet.) |
1. Tableau Software
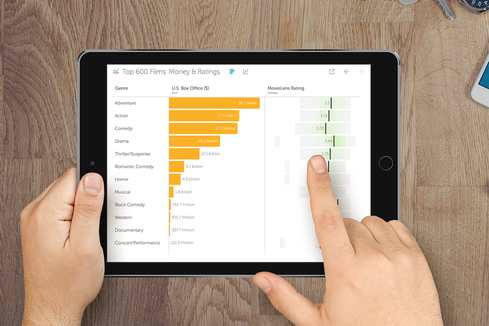
Tableau Software is perhaps the best known platform for data visualization across a wide array of users. Some Coursera courses dedicated to data visualization use Tableau as the underlying platform. The Seattle-based company describes its mission this way: "We help people see and understand their data."
This company, founded in 2003, offers a family of interactive data visualization products focused on business intelligence. The software is offered in desktop, server, and cloud versions. There's also a free public version used by bloggers, journalists, quantified-self hobbyists, sports fans, political junkies, and others.
Tableau was one of three companies featured in the Leaders square of the 2016 Gartner Magic Quadrant for Business Intelligence and Analytics Platforms.
(Image: Tableau Software)
2. Qlik
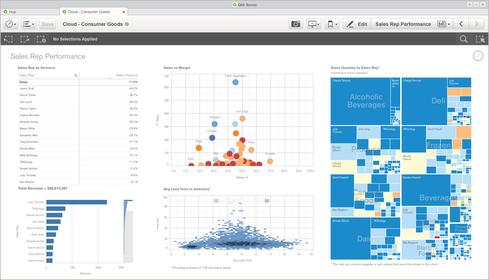
Qlik was founded in Lund, Sweden in 1993. It's another of the Leaders in Gartner's 2016 Magic Quadrant for Business Intelligence and Analytics Platforms. Now based in Radnor, Penn., Qlik offers a family of products that provide data visualization to users. Its new flagship Qlik Sense offers self-service visualization and discovery. The product is designed for drag-and-drop creation of interactive data visualizations. It's available in versions for desktop, server, and cloud.
(Image: Qlik)
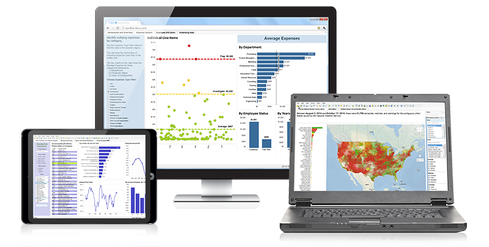
3. Microsoft Power BI
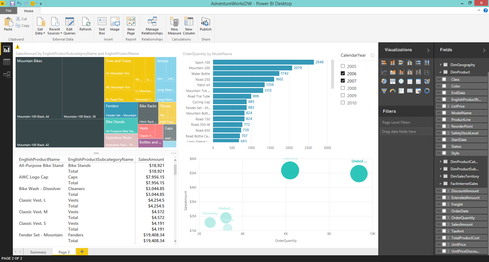
Microsoft Power BI, the software giant's entry in the data visualization space, is the third and final company in the Leaders square of the Gartner 2016 Magic Quadrant for Business Intelligence and Analytics Platforms.
Power BI is not a monolithic piece of software. Rather, it's a suite of business analytics tools Microsoft designed to enable business users to analyze data and share insights. Components include Power BI dashboards, which offer customizable views for business users for all their important metrics in real-time. These dashboards can be accessed from any device.
Power BI Desktop is a data-mashup and report-authoring tool that can combine data from several sources and then enable visualization of that data. Power BI gateways let organizations connect SQL Server databases and other data sources to dashboards.
(Image: Microsoft)
4. Oracle Visual Analyzer
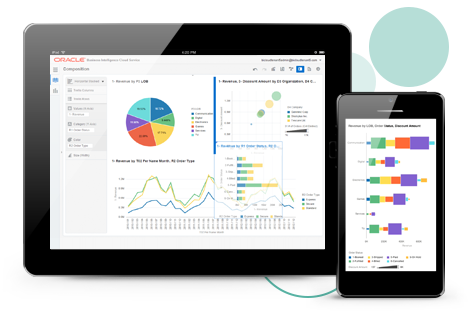
Gartner dropped Oracle from its 2016 Magic Quadrant Business Intelligence and Analytics Platform report. One of the company's newer products, Oracle Visual Analyzer, could help the database giant make it back into the report in years to come.
Oracle Visual Analyzer, introduced in 2015, is a web-based tool provided within the Oracle Business Intelligence Cloud Service. It's available to existing customers of Oracle's Business Intelligence Cloud. The company's promotional materials promise advanced analysis and interactive visualizations. Configurable dashboards are also available.
(Image: Oracle)
5. SAS Visual Analytics
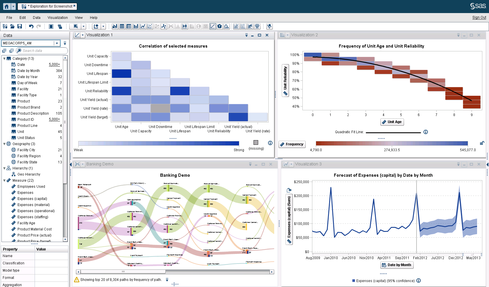
SAS is one of the traditional vendors in the advanced analytics space, with a long history of offering analytical insights to businesses. SAS Visual Analytics is among its many offerings.
The company offers a series of sample reports showing how visual analytics can be applied to questions and problems in a range of industries. Examples include healthcare claims, casino performance, digital advertising, environmental reporting, and the economics of Ebola outbreaks.
(Image: SAS)
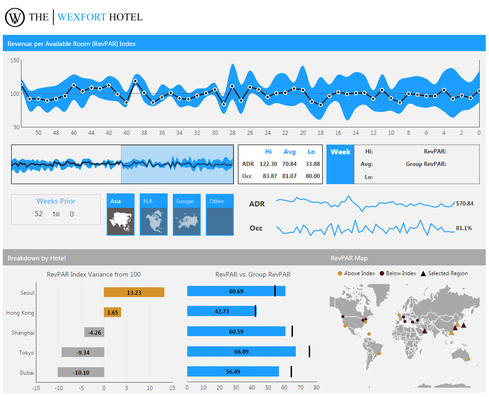
6. TIBCO Spotfire
TIBCO acquired data discovery specialist Spotfire in 2007. The company offers the technology as part of its lineup of data visualization and analytics tools. TIBCO updated Spotfire in March 2016 to improve core visualizations. The updates expand built-in data access and data preparation functions, and improve data collaboration and mashup capabilities. The company also redesigned its Spotfire server topology with simplified web-based admin tools.
(Image: TIBCO Spotfire)
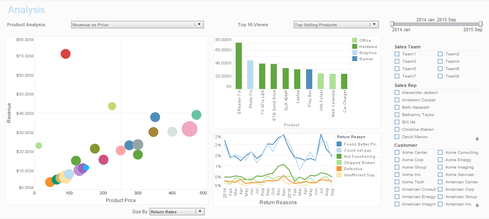
7. ClearStory Data
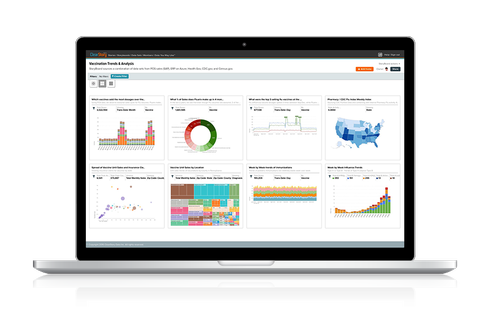
Founded in 2011, ClearStory Data is one of the newer players in the space. Its technology lets users discover and analyze data from corporate, web, and premium data sources. It includes relational databases, Hadoop, web, and social application interfaces, as well as ones from third-party data providers. The company offers a set of solutions for vertical industries. Its customers include Del Monte, Merck, and Coca-Cola.
(Image: ClearStory Data)
8. Sisense
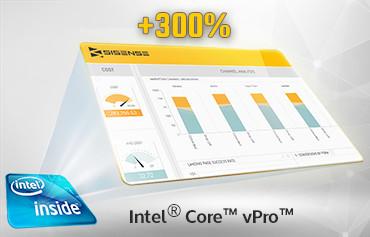
The web-enabled platform from Sisense offers interactive dashboards that let users join and analyze big and multiple datasets and share insights. Gartner named the company a Niche Player in its Magic Quadrant report for Business Intelligence and Analytics Platforms. The research firm said the company was one of the top two in terms of accessing large volumes of data from Hadoop and NoSQL data sources. Customers include eBay, Lockheed Martin, Motorola, Experian, and Fujitsu.
(Image: Sisense)
9. Dundas BI
Mentioned as a vendor to watch by Gartner, but not included in the company's Magic Quadrant for Business Intelligence and Analytics Platforms, Dundas BI enables organizations to create business intelligence dashboards for the visualization of key business metrics. The platform also enables data discovery and exploration with drag-and-drop menus. According to the company's website, a variety of data sources can be connected, including relational, OLAP, flat files, big data, and web services. Customers include AAA, Bank of America, and Kaiser Permanente.
(Image: Dundas)
10. InetSoft
Inet Software is another vendor that didn't qualify for the Gartner report, but was mentioned by the research firm as a company to watch.
InetSoft offers a colorful gallery of BI Visualizations. A free version of its software provides licenses for two users. It lets organizations take the software for a test drive. Serious users will want to upgrade to the paid version. Customers include Flight Data Services, eScholar, ArcSight, and Dairy.com.
(Image: InetSoft)